We have been warning for quite some time now that the market is completely unhinged and may explode anytime and enter into a full-blown crisis mode. In fact, it is a ticking time bomb that can implode anytime at first followed by explosion in the real economy.
The irony of it all is that the beneficiaries of the current market excesses are few privileged ones, i.e. the Wall Street types, not the Main Street types or the “Real Economy”. However, the explosion or the real effect of this implosion shall be felt by the real economy. In fact, they are all being felt already in way of high inflation.
“Privatize the profits and subsidize the losses” has always been the mantra of the elites driven by the Wall Street and the masses of ignorants are happy to oblige, unfortunately.
We just do not know the exact timing of when the implosion occurs. Yet, it continues to feel that we are eerily close to it. It is not a question of “if”, rather, it is a question of “when” – which is frankly anyone’s guess. However, that does not mean that we shall not prepare for such a dire situation. We must diligently do that in order to keep our portfolios in a fair health…or else, our portfolio can implode as well, which we rather not see.
Major stock market indices are completely out-of-control by ‘reckless’ acts from both fronts – the fiscal as well as monetary policies. Clearly, ‘people’ are to blame as well since they act like there is no tomorrow. Investors are not “true investors”, rather many of them, especially the ones that do matter, such as professional or institutional investors, have turned into gamblers, not just even speculators without any regard to the valuations, especially as they “play” with other people’s money.
As a result, we have culled the list of the candidates that are prone to implosion now. In our previous post, we covered the stocks that are down significantly from their peak already and this is only the beginning. Worse is yet to come.
Major indices are in an outright danger territory. See below as illustrated by two indicators – CAPE Shiller PE ratio (10 year average price-to-earnings ratio) and The Buffett indicator – market cap to GDP ratio.
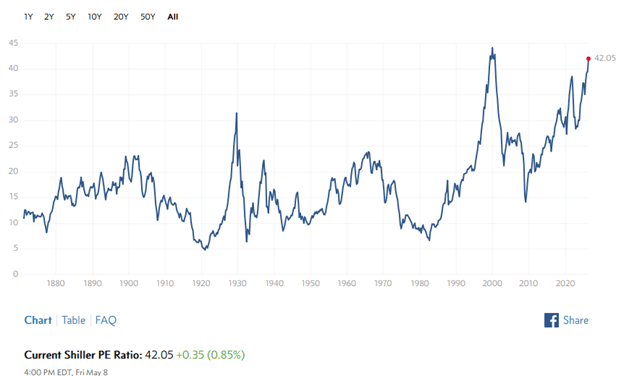
Source: Shiller PE Site
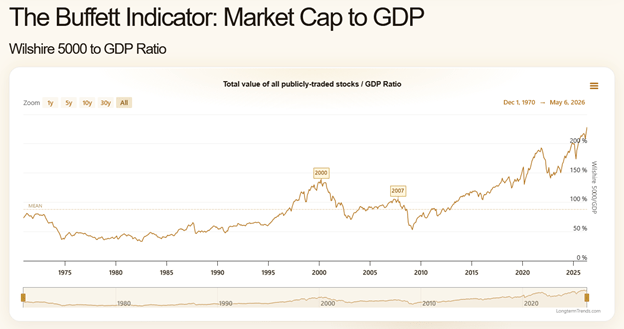
Source: LongTerm Trends Site
Picture is worth the thousand words! And if one picture tells the whole story then it will be either of the above two! Take your pick!!
Using a criterion of modestly high to “nose bleeding” valuations such as price to sales (PTS) ratio of over 7 and market cap in excess of $100 billion, here are the stocks that made the list of “ticking time bombs” – 43 of them sorted in the order of high to low PTS. See the list below.
| Company name | Ticker | Mktcap | Price | PTS | Down% | % Chge. 52 week | GM 3YA |
| Palantir Technologies Inc. | PLTR | 329,875 | 137.80 | 63.14 | 34 | 25 | 81.07 |
| Broadcom Inc. | AVGO | 2,038,630 | 430.00 | 29.86 | 2 | 110 | 75.53 |
| CrowdStrike Holdings, Inc. | CRWD | 133,297 | 527.77 | 27.70 | 7 | 25 | 75.00 |
| AppLovin Corporation | APP | 158,088 | 468.55 | 25.65 | 37 | 54 | 84.13 |
| NVIDIA Corporation | NVDA | 5,230,634 | 215.22 | 24.22 | 1 | 84 | 72.93 |
| Advanced Micro Devices, Inc. | AMD | 742,415 | 455.19 | 19.82 | 0 | 354 | 51.93 |
| KLA Corporation | KLAC | 244,694 | 1869.19 | 18.68 | 4 | 169 | 60.23 |
| Arista Networks, Inc. | ANET | 178,304 | 141.77 | 18.36 | 21 | 64 | 63.37 |
| Marvell Technology, Inc. | MRVL | 144,270 | 170.13 | 17.61 | 3 | 202 | 46.70 |
| Sandisk Corporation | SNDK | 231,226 | 1562.34 | 17.54 | 0 | 4368 | 17.57 |
| Analog Devices, Inc. | ADI | 203,626 | 416.52 | 17.32 | 1 | 108 | 60.87 |
| Lam Research Corporation | LRCX | 367,483 | 294.05 | 16.95 | 1 | 292 | 47.13 |
| Seagate Technology Holdings | STX | 172,963 | 782.64 | 15.71 | 2 | 720 | 26.00 |
| Intuitive Surgical, Inc. | ISRG | 159,726 | 450.06 | 15.09 | 25 | -16 | 66.63 |
| CME Group Inc. | CME | 101,058 | 281.25 | 14.99 | 15 | -1 | 100.00 |
| Palo Alto Networks, Inc. | PANW | 146,348 | 207.88 | 14.79 | 7 | 10 | 73.33 |
| Micron Technology, Inc. | MU | 840,886 | 746.79 | 14.47 | 0 | 804 | 21.63 |
| Prologis, Inc. | PLD | 134,185 | 144.09 | 14.31 | 1 | 37 | 75.87 |
| Texas Instruments Incorporated | TXN | 261,610 | 287.80 | 14.19 | 2 | 75 | 59.33 |
| Tesla, Inc. | TSLA | 1,385,284 | 428.35 | 14.15 | 14 | 55 | 18.03 |
| Visa Inc. | V | 605,267 | 318.79 | 14.07 | 15 | -9 | 97.77 |
| Western Digital Corporation | WDC | 164,162 | 480.01 | 13.94 | 1 | 984 | 29.70 |
| Howmet Aerospace Inc. | HWM | 108,765 | 270.56 | 13.18 | 4 | 72 | 31.00 |
| Mastercard Incorporated | MA | 441,473 | 495.48 | 13.01 | 18 | -13 | 100.00 |
| Welltower Inc. | WELL | 150,206 | 214.63 | 12.77 | 2 | 42 | 39.80 |
| Applied Materials, Inc. | AMAT | 345,238 | 435.36 | 12.24 | 1 | 179 | 47.63 |
| Vertiv Holdings Co | VRT | 130,182 | 339.97 | 12.01 | 6 | 256 | 35.97 |
| Intel Corporation | INTC | 634,841 | 124.90 | 11.81 | 4 | 515 | 38.50 |
| Eli Lilly and Company | LLY | 848,389 | 948.45 | 11.74 | 16 | 22 | 81.17 |
| Shopify Inc. | SHOP | 144,028 | 110.51 | 11.65 | 39 | 17 | 49.43 |
| Alphabet Inc. | GOOGL | 4,848,227 | 400.71 | 11.48 | 0 | 165 | 58.17 |
| Equinix, Inc. | EQIX | 105,484 | 1072.08 | 11.07 | 5 | 23 | 49.53 |
| Southern Copper Corporation | SCCO | 152,253 | 185.29 | 10.46 | 17 | 118 | 57.77 |
| Corning Incorporated | GLW | 160,208 | 186.94 | 9.82 | 6 | 317 | 34.43 |
| Microsoft Corporation | MSFT | 3,082,236 | 415.06 | 9.68 | 25 | -4 | 69.17 |
| Apple Inc. | AAPL | 4,303,041 | 293.26 | 9.53 | 1 | 49 | 45.73 |
| Vertex Pharmaceuticals | VRTX | 109,217 | 429.82 | 8.94 | 15 | -1 | 54.03 |
| Oracle Corporation | ORCL | 563,160 | 195.95 | 8.79 | 43 | 31 | 71.57 |
| S&P Global Inc. | SPGI | 124,902 | 420.12 | 7.94 | 27 | -17 | 68.80 |
| Netflix, Inc. | NFLX | 369,397 | 87.48 | 7.88 | 35 | -24 | 45.37 |
| McDonald’s Corporation | MCD | 196,941 | 275.75 | 7.33 | 19 | -13 | 57.10 |
| Meta Platforms, Inc. | META | 1,544,802 | 609.63 | 7.19 | 23 | 2 | 81.50 |
| GE Vernova Inc. | GEV | 279,800 | 1040.15 | 7.11 | 12 | 156 | 17.73 |
Source: Stock Investor Pro by AAII
This is where the highest amount of froth resides as they are mega-cap companies and many of them with the low gross margins and puny net profit margins or at least not sustainable enough due to one-time major windfall effect from artificial intelligence (AI) hype.
They can and will drop like a rock once they get out of favor, especially the ones with the low margins such as commodity types, i.e. memory chip makers and data center companies. They are flying high and before we know it, they will come back down to earth. We have seen a huge spike in their gross margins from subpar 3-year average to over-the-top trailing twelve months average due to artificial demand and AI windfall, hence they are up beyond reason.
As a reference, here are some standouts:
- See some staggering numbers here for their upward trajectory in last 12 months – these are not percents – they are multipliers – all semiconductor companies!
- Sandisk (SNDK): 40x
- Western Digital (WDC): 10x
- Micron (MU): 8x
- Seagate (STX): 7x
- Intel (INTC): 5x
- Advanced Micro Devices (AMD): 3.5x
- Following ones have started their trajectory down towards the earth again, though, some of them still have their price to sales ratio near the top of the list:
- Oracle (ORCL): -43%
- Shopify (SHOP): -39%
- AppLovin (APP): -37%
- Netflix (NFLX): -35%
- Palantir (PLTR): -34%
- Microsoft (MSFT): -25%
- Meta (META): -23%
- More to come and many more casualties to be added next to the list above as a great majority of them are in an outright danger zone territory.
Walmart (WMT) and Amazon (AMZN) would not even make this list as their price to sales ratios are lower than our criteria here. However, they are equally vulnerable as their margins are even lower, materially lower! Tread carefully!!

Leave a comment