Business Week magazine famously put out a cover story stating “The Death of Equities” in August of 1979. Well, that was the beginning of a multi-decade bull market in the U.S. stock market history, lasting well over 4 decades to be more precise. In between, clearly, we have had two “Lost Decades” or “near” lost decades – after the “Dot Com Bust” in year 2000 and “Great Financial Crisis” (GFC) of 2008.
As a comparison and context, Japan’s Nikkei 225 Index straddled for the decades well below the peak of 40,000 made in 1989 only to break out in early 2024 or after about 34 years. That is not just the lost decade, rather “Lost Decades”.
Coming back to the U.S., we are now in a thick and protracted bear market or rather in a very first inning of the “bear game” that it will be extremely difficult to climb out of it for a very long time.
We covered the trillion-dollar valuation club members just about six months ago on October 1, 2025 via the following post: Trillion Dollar Valuation Club in U.S. Stock Market. The list covered 9 members at the time as follows.
Nvidia (NVDA): $4.55 trillion
Microsoft (MSFT): $3.85 trillion
Apple (APPL): $3.79 trillion
Google parent Alphabet (GOOG): $2.95 trillion
Amazon (AMZN): $2.34 trillion
Facebook parent Meta (META): $1.85 trillion
Broadcom (AVGO): $1.56 trillion
Tesla (TSLA): $1.43 trillion
Berkshire Hathaway (BRK): $1.08 trillion
It is about time to revisit the list as it has been about 6 months since then. Also, we anticipated to do so every now and then. Interestingly, during this time period what has happened is that this exclusive club gained one new member – yes, a new member, Walmart (WMT) – only to be dropped in the short few months.
Walmart announced a new Chief Executive Officer (CEO) on February 1 of this year and voila, it hit a trillion-dollar market cap in about 2 days after that. Since then, it has straddled around this figure. However, the stark reality is that even Walmart stock has gotten expensive or rather super-expensive to be more accurate.
Walmart at around the share price of $125, down about 7% from the peak of $135 is trading at 66 times price to free cashflow (PFCF), equivalent of a true price to earnings (PE) ratio. It is roughly 3 to 4 times where it could be in a more rational world of 15 to 20! Yet various sources on the Internet including Yahoo Finance somehow continue to point out the PE ratio at 46. As an example, see the PE table and chart below from the Macrotrends.net site.
Go figure as to how the “expert” Wall Street analysts calculate the earnings!
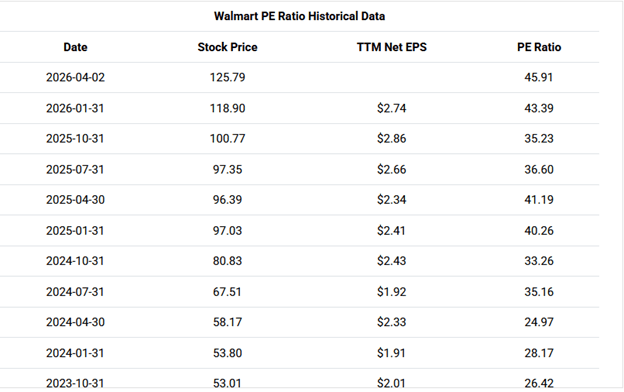
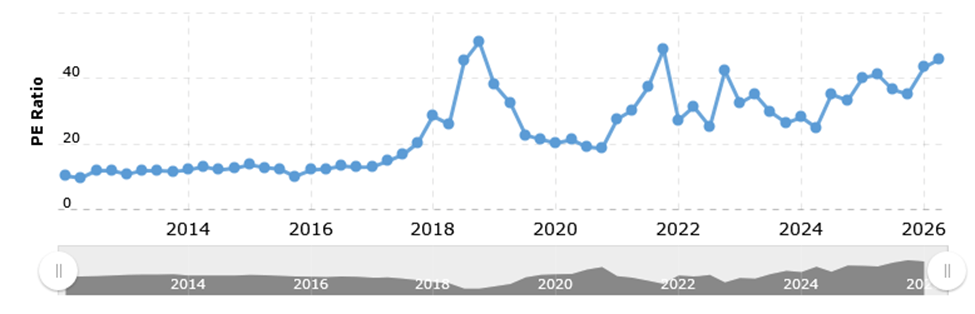
Source: Macrotrends.net
Even the financials on the Walmart corporate website, the number shown below speak to the same truth of price to free cashflow at 66 for the last 12 months as well as 3 years. See below.
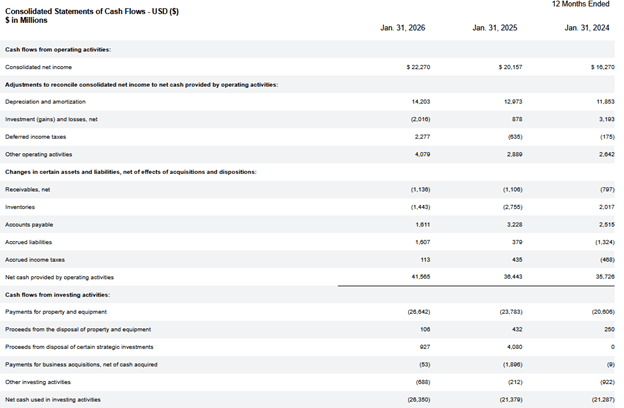
Source: Walmart Corporate Site
Now, let us see how the exclusive members of the trillion-dollar club have fared since our last write-up about 6 months ago.
| Company name | Ticker | Mktcap ($mils) 04/01/26 | Mktcap ($mils) 10/01/25 | Percent Change | Price | Down% from Peak | Price to Free Cashflow | Price to Sales | Price to Book |
| NVIDIA Corporation | NVDA | $4.27 | $4.55 | -6% | $176 | 17% | 44.18 | 19.78 | 32.08 |
| Apple Inc. | AAPL | $3.77 | $3.79 | -1% | $256 | 11% | 30.57 | 8.65 | 42.75 |
| Alphabet Inc. | GOOG | $3.56 | $2.95 | 21% | $295 | 16% | 48.59 | 8.84 | 9.32 |
| Microsoft Corporation | MSFT | $2.74 | $3.85 | -29% | $369 | 34% | 35.46 | 8.99 | 10.94 |
| Amazon.com, Inc. | AMZN | $2.25 | $2.34 | -4% | $211 | 19% | 293.05 | 3.15 | 5.96 |
| Broadcom Inc. | AVGO | $1.49 | $1.56 | -5% | $313 | 24% | 51.41 | 21.77 | -30.82 |
| Meta Platforms, Inc. | META | $1.46 | $1.85 | -21% | $579 | 27% | 31.72 | 7.28 | 7.74 |
| Tesla, Inc. | TSLA | $1.23 | $1.43 | -14% | $381 | 24% | 198.05 | 12.99 | 14.87 |
| Berkshire Hathaway | BRK.A | $1.03 | $1.08 | -5% | $716,258 | 12% | 41.14 | 2.77 | 1.71 |
As you can see, Google is the only company having its stock price up during this time period. That, too, has taken place more on the backs of the rising valuation levels than due to any other key underlying factors.
In essence, here are the key changes that we witnessed during the last 6 months:
- Nvidia likely hit the ‘terminal’ cap of $5 trillion in October of 2025 and it is really struggling to make a new high since then in spite of cranking out good numbers
- Microsoft dropped in the rank from # 2 to 4. Basically, it is gradually coming back down to earth
- Google is the only company to register the gain whereas everyone else is in a negative territory. That is simply because it catapulted from the expensive to even more expensive position
This is only the beginning of a long, a very long, downward trajectory as alluded in our posts earlier that the crisis has already set in.
Iran war only makes this crisis much worse. So, buckle up, please.
No wonder Elon Musk is hurrying up to bring SpaceX public very soon to cash out and say ‘kaching’ before the market goes completely “cold” or “kaput” for them just as it has already for the ordinary investors. Ditto with Sam Altman for OpenAI with the assistance of “Wall Street Wolves” ever ready to feed on the innocent or unsuspecting ones.
The next set of casualties shall be from the bottom of the above exclusive members list. The most vulnerable of all are Tesla, Meta, Broadcom or even Amazon as the reality sets in the all the hot air pops out of the balloon gradually.
Berkshire Hathaway is a different story and they may well earn their coveted spot as they are already sitting on close to $400 billion cash. It is an expensive stock, yet, they can grow into that valuation by the time sanity returns to the market. It is one of the very few beautiful flowers in an ugly, very ugly, garden full of weeds.
What to expect next? Expect more of the same for the foreseeable future at least until changes and it will be a while, a long while, before much changes. So, we need to be patient. Very patient.
The irony is that unlike 1979 infamous call of “Death of Equities”, this is the time that such a cover is warranted, really. However, we are unlikely to see that. We generally do not. Instead, we have only seen the headlines of the “Beginning of the New Bull Market” in last one or two years ever since the AI craze gained a big foothold in the investor psyche.
Now is truly the time to say “The Death of Equities”. Cherry on the top… include “The Death of Bonds”. Hence, together, it will be a more apt title to state that “The Death of Stocks and Bonds”. For its part, the Bonds have started dying already for the last couple years already as the yields have continued to spike up from near zero during the COVID time to slowly marching towards 5 percent range for the 10-year treasuries.
With Iran war, the U.S. has a situation of a “foot in the mouth” and it is truly the oil and gold price that will keep our “lost” president straight yet no indication of that happening anytime soon.
All thanks to the most incompetent leader, U.S. has ever witnessed and unfortunately, the world at large as it relies heavily on the U.S. or at least highly interlinked with the U.S. We are in a very, very, unpleasant, uncomfortable and unfortunate situation in the U.S. and dragging the rest of the world along with us. It is such a pity.

Leave a comment